Geography Fieldwork in Year 1
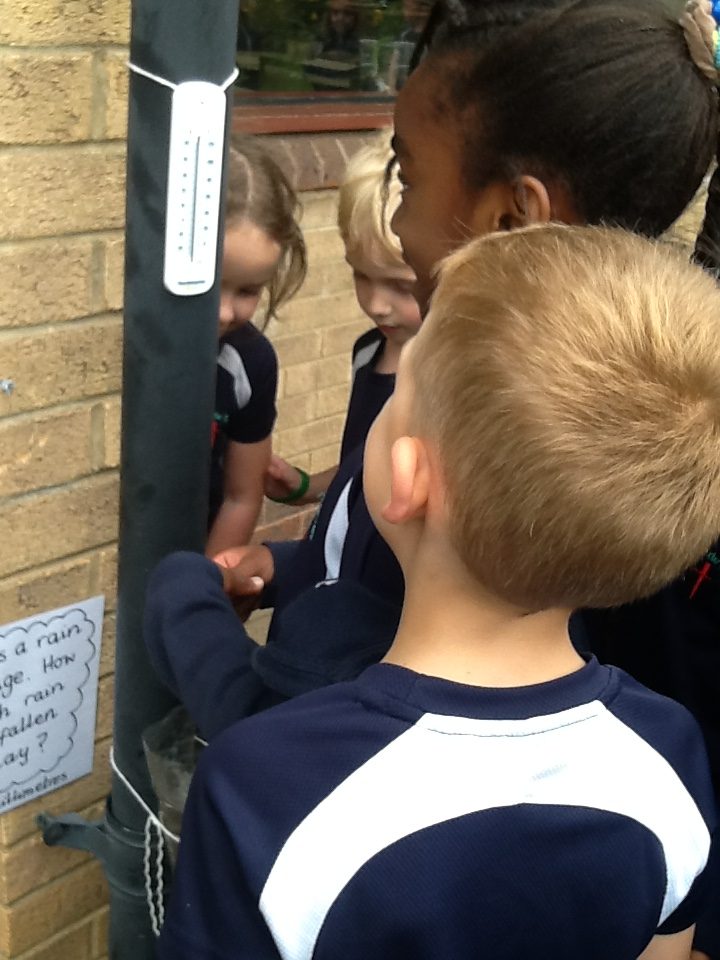
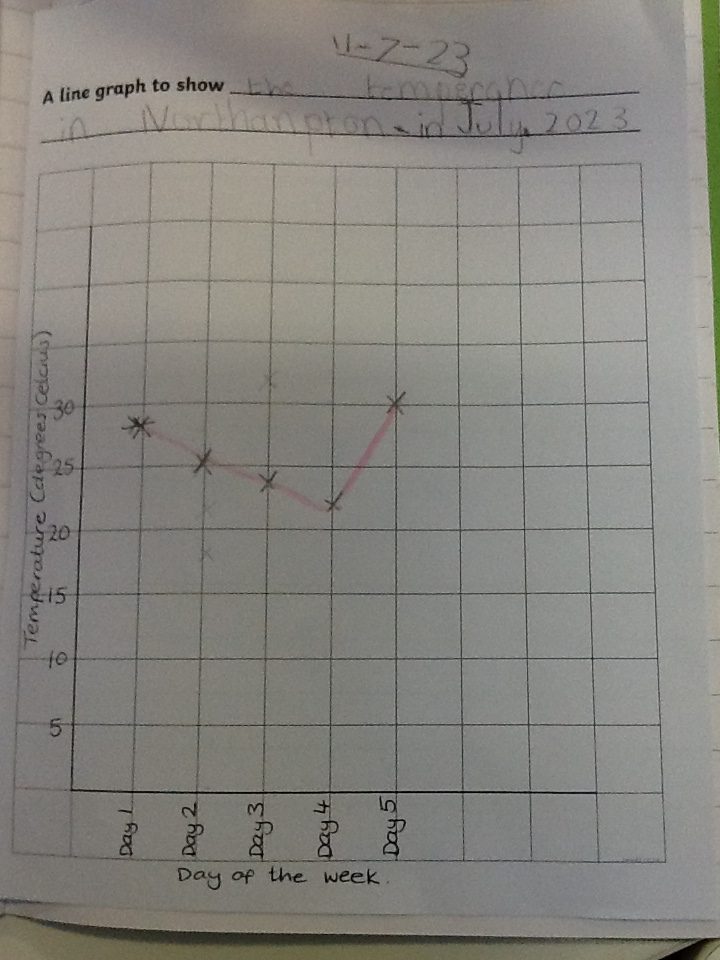
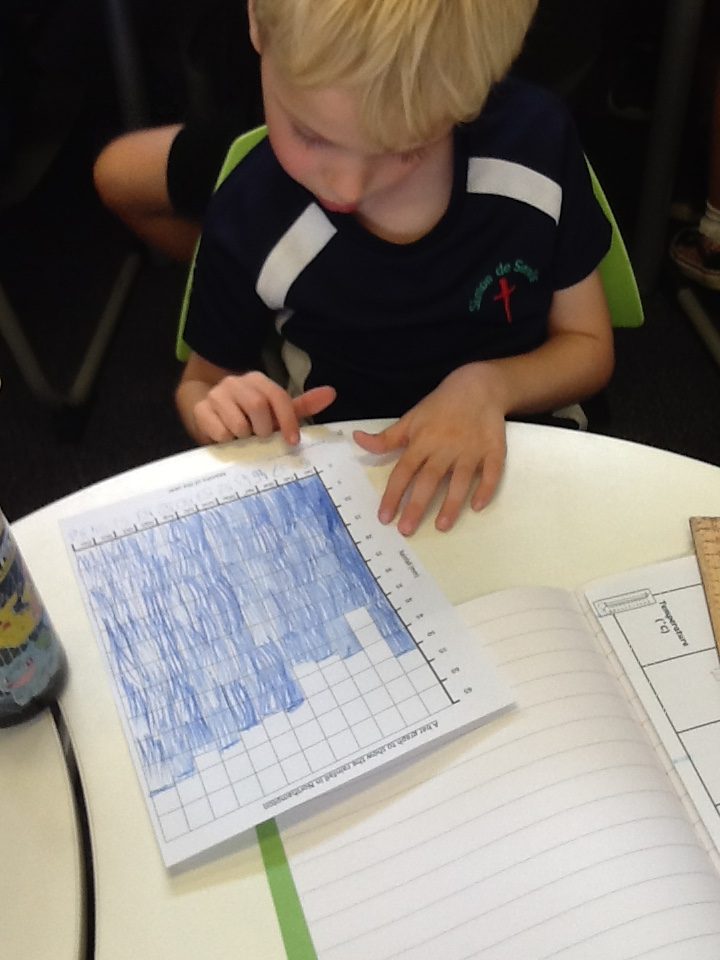
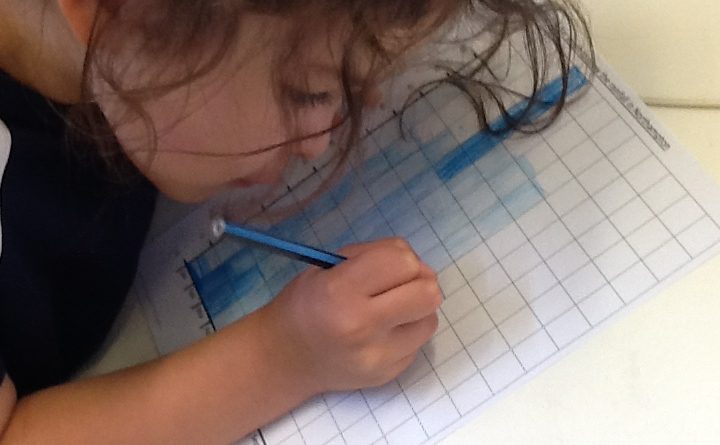
Over the last fortnight we have been recording the temperature and rainfall using thermometers and a rain gauge outside our classroom. Today we looked at the information we had collected and drew graphs to present what we had found. We drew line graphs to record the temperature and then noticed that there was only rainfall on one day. We then looked at the average rainfall in Northampton over a year and compared this to Chembakolli a village we are learning about in India. We found out that:
- The warmest day we recorded was on Friday.
- The coolest day we recorded was on Thursday.
- The wettest day was the Tuesday.
- The wettest month in Northampton is December.
- The wettest month in Chemakolli is July when it is there monsoon season and they get a lot more rain that we do in a shorter time.
- The temperature in India is higher than in England.
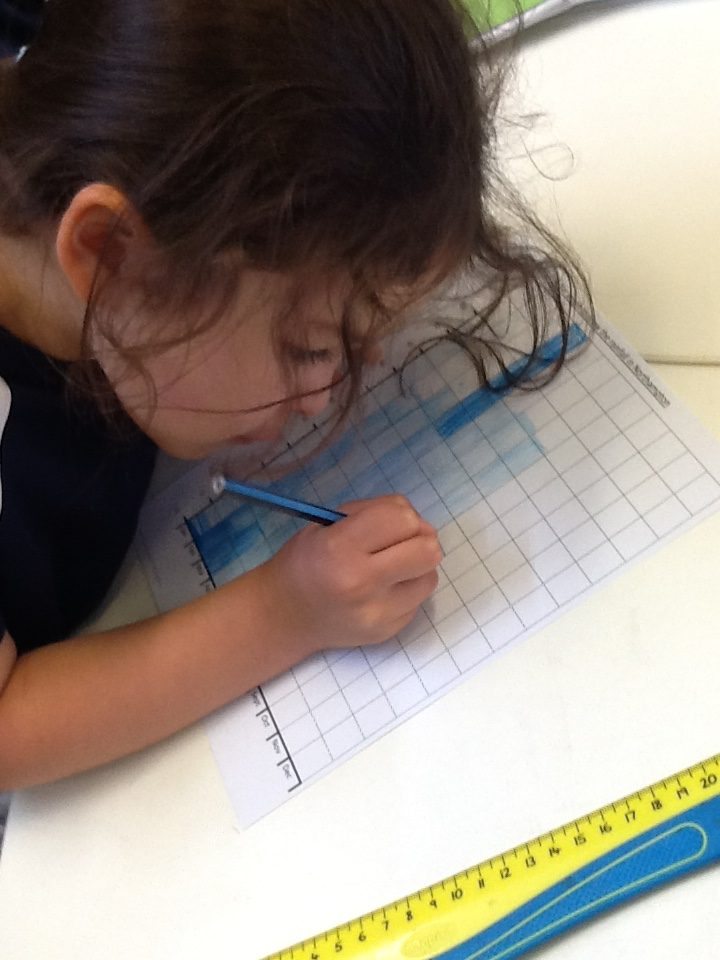
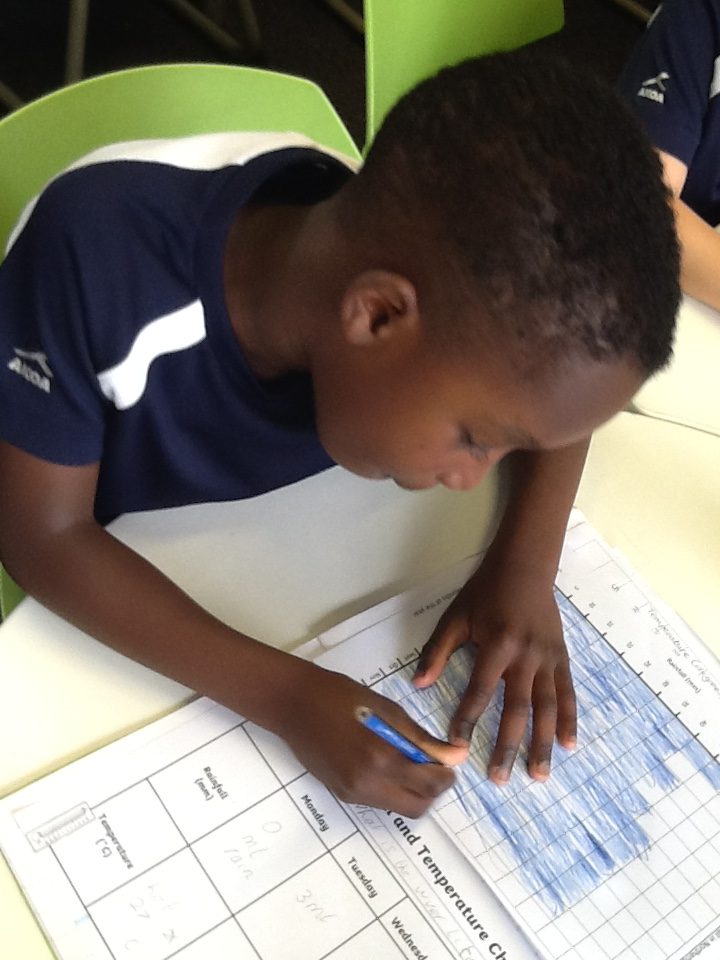
The children have made accurate observations recording the temperatures and rainfalls over the week and worked carefully to create line and bar graphs to present information today.